Last Updated on July 9, 2025 by Allen
Calculating ROI of CX Guide | FREE Spreadsheets
This blog is a comprehensive guide to calculating the ROI of CX. It features insights, tools, and resources that have been developed to help customer experience (CX) professionals make more informed and accurate CX return on investment (ROI) calculations, which in turn translates into more efficient strategies and better management tools for organizations.
I’ve provided a step-by-step guide to help measure your customer experience.
I’ve also created two example spreadsheets just for you: the Net Promoter Score (NPS) Spreadsheet highlights company revenue and the ROI of NPS focus on the cost of customer acquisition.
How can you demonstrate the monetary gains derived from top-notch customer service?
This guide will help you design your CX strategy to maximize ROI.
About the author
I’m Allen Quay, CEO of Review Dingo helping companies skyrocket revenue using the internet’s #1 reputation management platform. I was inspired to write this guide after listening to countless stories of CX professionals and executives struggling to prove the value of CX & NPS.
If you’re a CX professional struggling to be heard by executive teams, or an executive needing proof of ROI before launching a CX strategy, this guide is for you.
Included in this guide are four ROI of CX spreadsheets so you can do the calculations for your unique business. Simply submit the form below to get them all for FREE.
I’ve divided this guide into 7 Chapters:
Chapter 1: Importance of ROI in Business
Chapter 2: Why Calculating the ROI of CX is Hard?
Chapter 3: Fundamentals of Calculating the ROI of CX
Chapter 4: The Math Behind the ROI of CX Calculations
Chapter 5: Calculating the Impact of NPS on Revenue
Chapter 6: Calculating the Impact of NPS on Customer Acquisition Costs
Chapter 7: Key Takeaways
Chapter 1: Importance of ROI in Business
If you want to get executives on board with customer experience you have to prove that it helps the bottom line. Tying customer-centric initiatives to revenue and metrics tells a better story than anecdotal proof. The ROI of CX is quite impressive. For example:
- Customer-centric companies are 60% more profitable than companies that don’t focus on customers.
- Brands with superior customer experience bring in 5.7 times more revenue than competitors that lag in customer experience.
- 84% of companies that work to improve their customer experience report an increase in their revenue.
Throwing around these proven statistics is all well and good but you won’t have that executive buy-in, approval for your budget, or communications of progress to drive success in your career without being able to fully understand and prove the ROI of CX.
CX executives are starting to embrace metrics such as customer experience (CX) performance that offer insight into customers and how they feel about companies and products. Those metrics used to be used to sell businesses and trades, but now they can be used to make great customer experiences.
I believe that metrics need to be followed up with decisions. For the remainder of the guide, we’ll use Net Promoter Score (NPS) as a metric of choice, but you can substitute something else instead.
Here are the reasons why proving the ROI of CX is hard.
Many CX professionals still struggle with proving that CX drives both profit and revenue.
The question is, how can you get people to take action on new ideas: demonstrate program impact, and get visible?
First, showing the linkages between NPS and financial metrics first and then demonstrating ROI is the key here.
But, where do we start?
To calculate the ROI of CX, it’s important to show the financial impact of customer experience.
In this guide, I share how to generate value by taking advantage of CX models. I’ll also discuss forward-looking strategies that will allow you to create an ROI of CX models in our pre-made spreadsheets.
Chapter 2: Why Calculating the ROI of CX is Hard?
ROI is as easy to calculate for any investment that has immediate results.
Facebook Retargeting Ads will make you realize within a week what kind of leads you can get from spending $1000 on Facebook ads.
Existing businesses know the value of new business development leads because they know how well they convert existing customers.
All you need to do is calculate the ROI and it’s essential to generate profits of around 2 or 3.
When it comes to getting positive customer experience (CX) improvements, they can take months, to see results. In addition, it’s a multi-step process:
Step 1. Evaluate CX using a metric like Net Promoter Score and identify the factors that determine its subjective nature. Is it customer feedback about the experience at your company or the quality of your product?
Step 2. Implement your program
Step 3. Wait to see the results.
Step 4. Measure NPS again and evaluate the change. Are customers mentioning the same old themes or are they noticing improvements?
One of the most important questions about the Investment Return on CX initiatives is how long it can take to adopt steps 2 and 3 and what the ROI will be.
However, if you avoid investing in the customer experience, it could have a much worse outcome than investing in advertising, like Facebook ads.
This is due to 3 reasons:
- Customer expectations are continuously growing;
- It is far easier to start a business and advertise to a global audience;
- Customers have become harder to retain or win back.
Chapter 3: Fundamentals of Calculating the ROI of CX
The first thing you will need is the following research to be completed for the ROI calculations to be valid.
Choose your metric. In our case, it’s NPS.
The idea behind NPS is simple: it identifies people who are more likely to recommend the company to others (Promoters), those who would not, and those who are less likely to recommend the company (Passive and Detractors).
According to websites like The Experience Exchange, companies with wonderful customer experience (CX) are more likely to get recommendations from people.
These things translate into financial metrics that eventually result in profits and growth: less churn, higher customer lifetime value, and decreasing cost of customer acquisition.
Based on your most recent NPS survey, you will need to collect two sets of metrics…
The average annual spend and the average number of referrals per NPS category. For example:
Referrals might be harder to measure, but do your best to come up with a creative way to track them.
At Review Dingo, our customers can easily track this metric through Referrals, an available feature within our CX platform.
Your referral numbers may not be the same, but they should follow a similar pattern…
Promoters spend more than Passives and Passives spend more than Detractors.
If your numbers don’t fit this pattern then something’s wrong and is an indication that the NPS isn’t being measured correctly.
Here are the commonly made mistakes in measurement we’ve noticed:
Asking users to provide feedback might prompt them to give inflated review scores, and evaluating the survey results by incentivizing individuals has led to poor results, including “Give me a 10 or don’t respond”, which is a common practice in some industries, such as car dealerships.
Chapter 4: The Math Behind the ROI of CX Calculations
So how do you quantify the investment into CX to help a brand stay current and relevant to the fast-paced changes in consumer behavior and expectations?
Let’s follow the same formula as we used for Facebook ads to figure this out.
4.1 What is the value of investment into CX?
Unlike on Facebook, the actions required to see an improvement in service quality will take a longer amount of time than a week to take root. Let’s assume it will take 6 months to reap the benefits.
When estimating the return on investment of a customer experience program, it should be a comparison of today’s financial metrics to what would be expected to be realizable six months from now.
When calculating the ROI for 6 months, the value of the CX strategy is the difference between the financial metrics of the past 6 months compared to the same metrics used today.
4.2 What are the costs of CX investments
When adding up the costs of investments into a CX strategy, companies typically invest in these areas:
1. Measuring satisfaction at various touchpoints and identifying specific touchpoints that are underperforming.
2. Understanding the NPS performance within your own company to benchmark it against the competitors in the industry to see what good vs. bad performance looks like.
3. Doing a driver analysis to see which particular factors have a positive and negative impact on NPS.
Pro Tip: When benchmarking data is available, as it is on our CX platform, insights into which trends or strategies work for competitors are incredibly valuable.
4. Strategies to drive NPS improvements:
- Improve experience when consumers evaluate your product by using your website and reading your marketing materials.
- Improve processes for onboarding new customers, delivering goods or services, and billing procedures.
- Improve UX when using your platform or digital products.
- Improve staff training so they can provide personalized service and understand customer needs and behaviors.
- Investing in the employee experience.
With the popularity of NPS, many companies have been investing heavily in element 1: The introduction of technologies to collect customer feedback across all different touchpoints.
Fewer companies invest in element 2, such as benchmarking NPS against competitors, than invest in element 1.
The struggle often lies in elements 3 and 4.
Companies often under-invest or don’t invest at all in understanding what impacts NPS and in the strategy to actually improve NPS over time.
Predicting what the future holds is rarely a sound strategy. Instead, try to measure whether customers have noticed an improvement in customer service and what experiences they value the most.
Let’s take a look at how to calculate the impact of NPS on revenue.
Chapter 5: Calculating the Impact of NPS on Revenue
I’ll calculate the value of the investment of CX by linking its metric, NPS, to revenue.
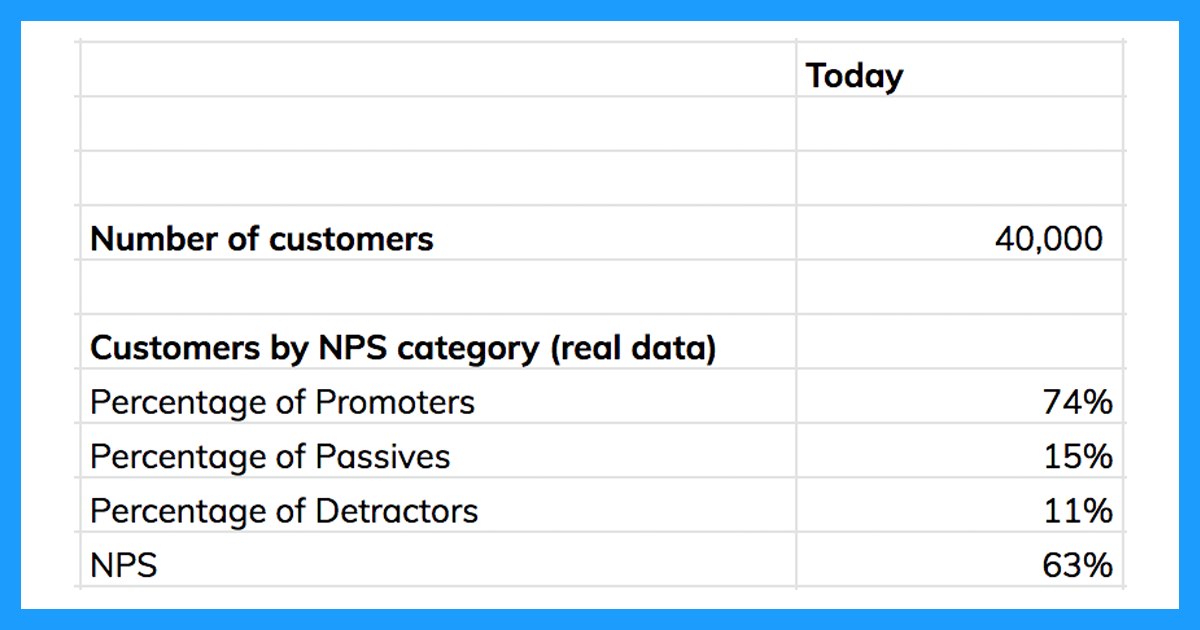
First, we will need two basic pieces of information: The total number of customers and a breakdown of the percentage of customers that land in each NPS category.
Next, you will need the average spend per customer, aggregated per NPS category as indicated in Section 1.
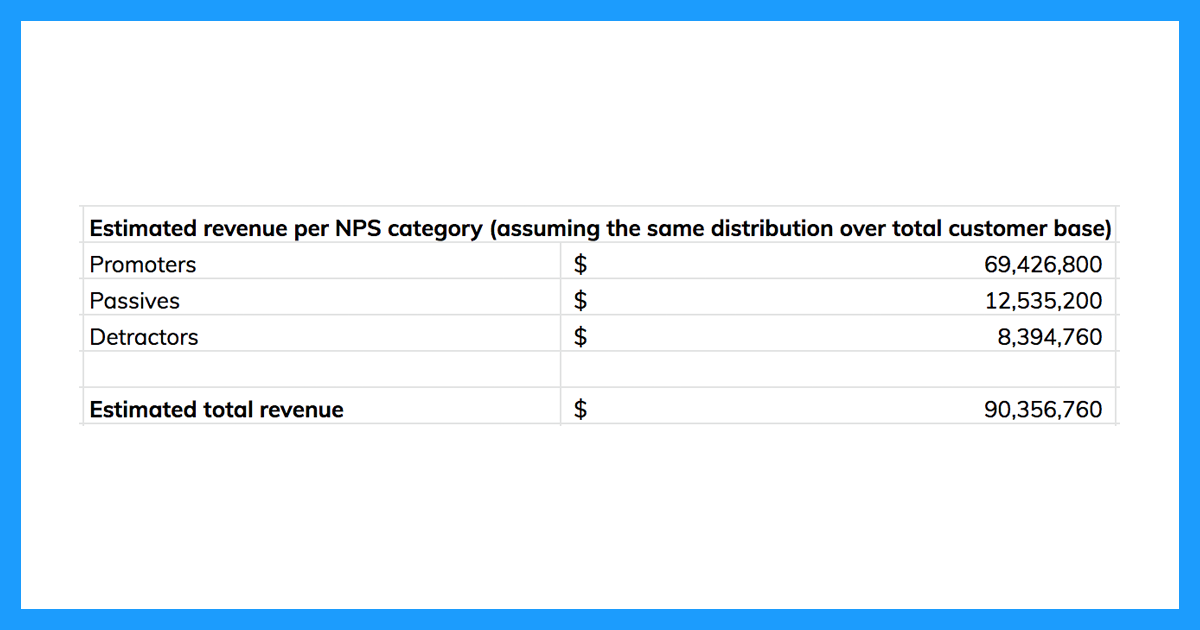
You can now multiply the two numbers to calculate the total revenue per NPS category.
These numbers alone can be quite insightful.
The sum is the estimated total revenue for the company and hopefully matches the actual total revenue.
Make sure to cross-reference here.
So, what would be the impact of an increase in NPS by a few points?
We need to make some assumptions here.
But here is a conservative example that shows some revenue growth in any case and models two scenarios:
A small increase in NPS was distributed among all NPS categories and no increase in NPS.
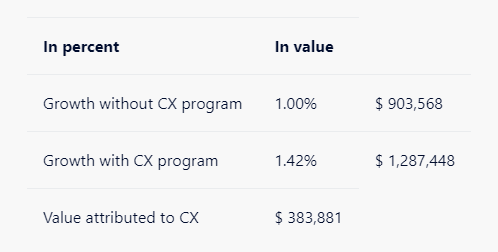
If we assume that the spend per customer stays the same, we arrive at the following numbers:
The increase in revenue with the CX program may not seem impressive, but it’s 42% higher than without it:
You can change the numbers to reflect our business by downloading our FREE toolkit. This will help you arrive at your own numbers.
The numbers will be much more beneficial if you can validate them relative to the metrics from the past.
In our example, the value of an NPS increase of 4 percent equates to around $384K.
A good 3x return on investment would be if this company spent $127,000 on that increase.
Chapter 6: Calculating the Impact of NPS on Customer Acquisition Costs
The adoption of a CX strategy can have positive effects on lowering customer acquisition costs.
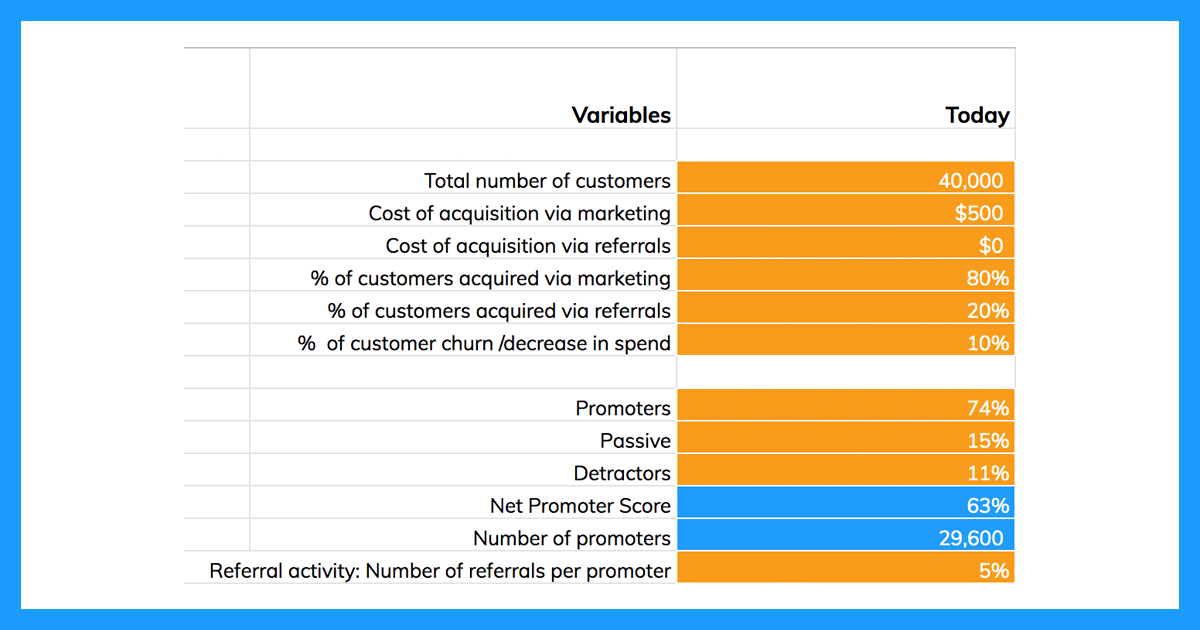
You will have to know the total number of customers including a breakdown of the percentage of customers that land in each NPS category.
Plus you will need:
- Current CAC (cost of customer acquisition) from marketing
- Cost of CAC from referral (usually zero, but some companies pay both customer and new customers a small finder’s fee.
- Percentage of customers gained through marketing vs. referrals
- An estimate of how many customers your promoters refer. For example; 1 out of 10 promoters may refer new customers.
Here’s an example of what these numbers could look like:
I suggest also measuring churn to see if your customer acquisition programs are counter-balancing churn which will typically occur.
With that, you would get these kinds of numbers:
In 6 months down the road, what would happen if these numbers significantly changed?
Your churn would likely drop if there was a 13% rise in NPS.
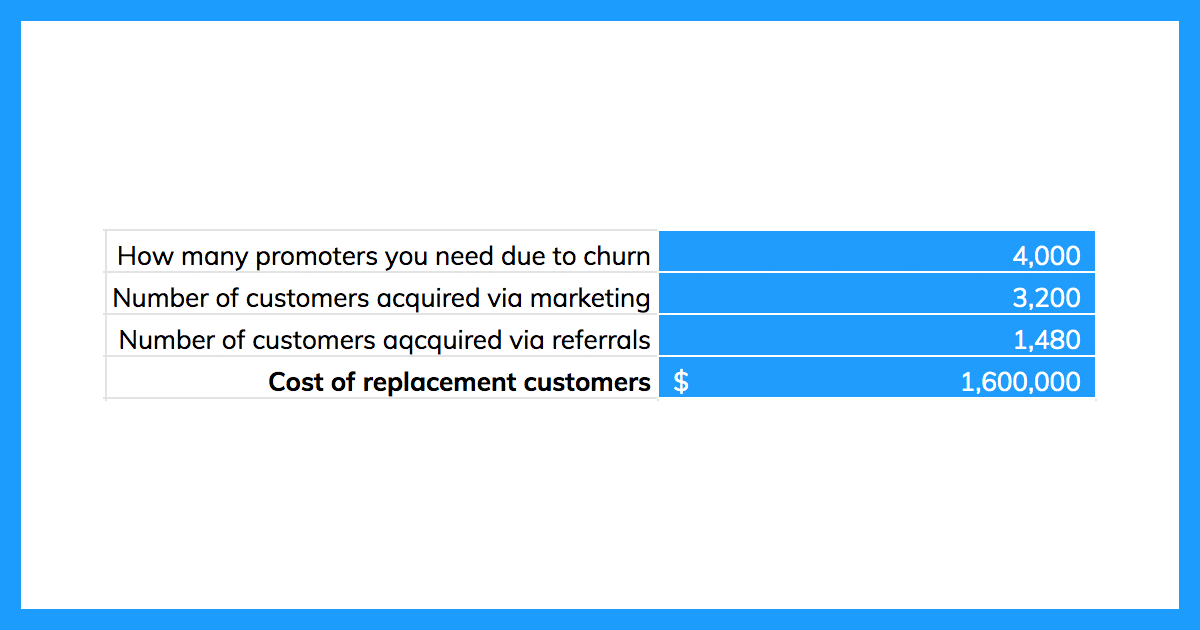
Let’s say NPS dropped by 2 percentage points and it was 8% collectively. Then the total percentage of customers you would need to replace using marketing is 8% * 40,000 = 3208 customers.
Since the NPS increased and the number of Promoters increased by 7 percentage points to 32,080, they are now generating more referrals, a total of 1604.
That’s exactly 50% and a significant reduction in costs required to replace churned customers.
The value of the CX strategy is almost $800,000 in this scenario.
You could also calculate the new CAC here, as the average across these two channels. This is evident: If you don’t take action, the odds are that CAC is not going to drop.
Chapter 7: Key Takeaways
Investment into getting the financial proof behind your CX strategy is important and necessary for your professional success.
You need to make sure you have the key metrics that pertain to the average spend on each NPS category and that these metrics match.
If they don’t align, there may be an issue with the survey.
It is hard to calculate customer experience ROI because implementing improvements can be expensive and take time to implement.
Implementing a CX strategy will be hard if you’re not using a good CX platform that provides key metrics and processes needed to improve your ROI. Even then you need to make sure you know what to improve and work on improving it to be successful.
Want the spreadsheets used in this guide? Get our free CX spreadsheets and formulas used in this guide. After opening it up, simply copy the Google doc and then replace it with your company data. All the formulas are built-in to give you the results.
Thank you for reading, and please feel free to contact us. I’d love to hear how you’re calculating customer experience ROI.


