How a painting contractor combined profile improvements, consistent business information, and geographic rank tracking—and what the comparison scans recorded.
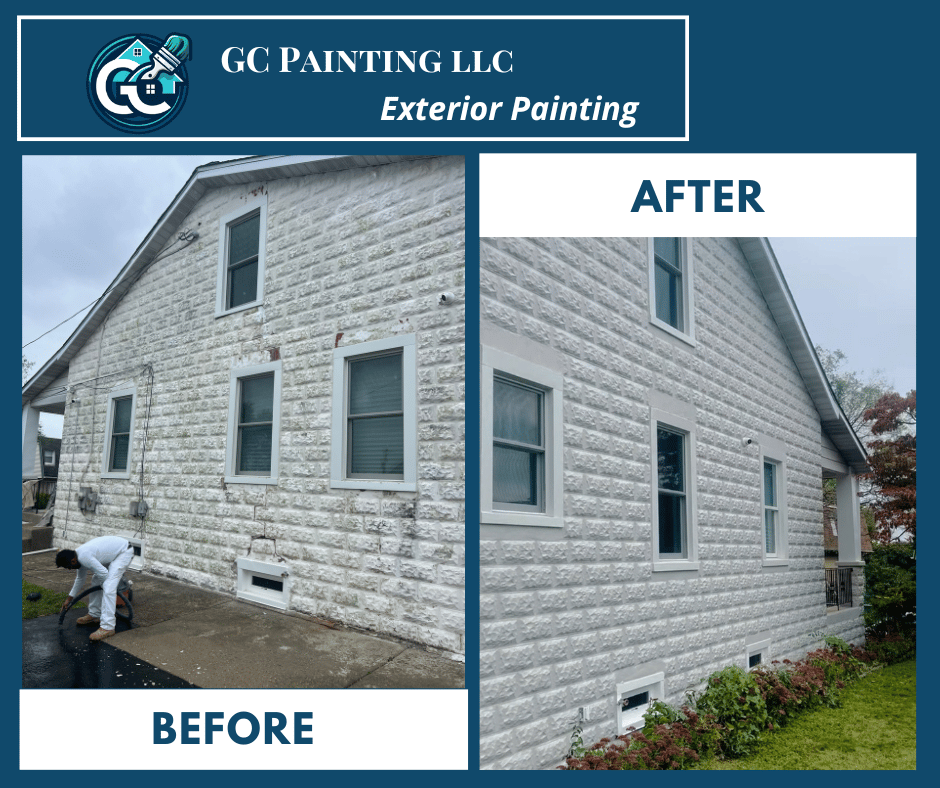
Exterior painting project from G.C. Painting's gallery. Photo source ↗
Business
G.C. Painting · Pennsylvania
Engagement period
July 23–September 12, 2026; rank comparison ends September 1
Contribution
Allen Quay served as local visibility consultant, working on profile foundations, content, citation consistency, and rank measurement.
The starting point
The challenge.
For G.C. Painting in Norristown, Pennsylvania, being visible near the business address was only part of the problem. The residential and commercial contractor needed to understand how its profile appeared across the surrounding service area.
The July 23 baseline averaged position 10.6 across seven tracked searches. Top-three coverage was 13.9% of measured grid points, averaged across those searches. That geographic baseline gave the engagement a more useful starting point than a single search from one location.
The work
What changed.
Allen Quay served as local visibility consultant, working on profile foundations, content, citation consistency, and rank measurement.
Make the profile specific to the work
The source records a rewritten business description, 31 individual services with descriptions, and updated profile attributes.
Maintain useful profile content
The engagement included 28 Google posts and 17 profile photos. These are documented activities, not evidence that a particular posting frequency causes ranking gains.
Keep business information consistent
The source reports 51 directories brought into sync, followed by weekly synchronization beginning in August. That historical count does not describe the coverage of a current Review Dingo plan.
Measure the same local search set
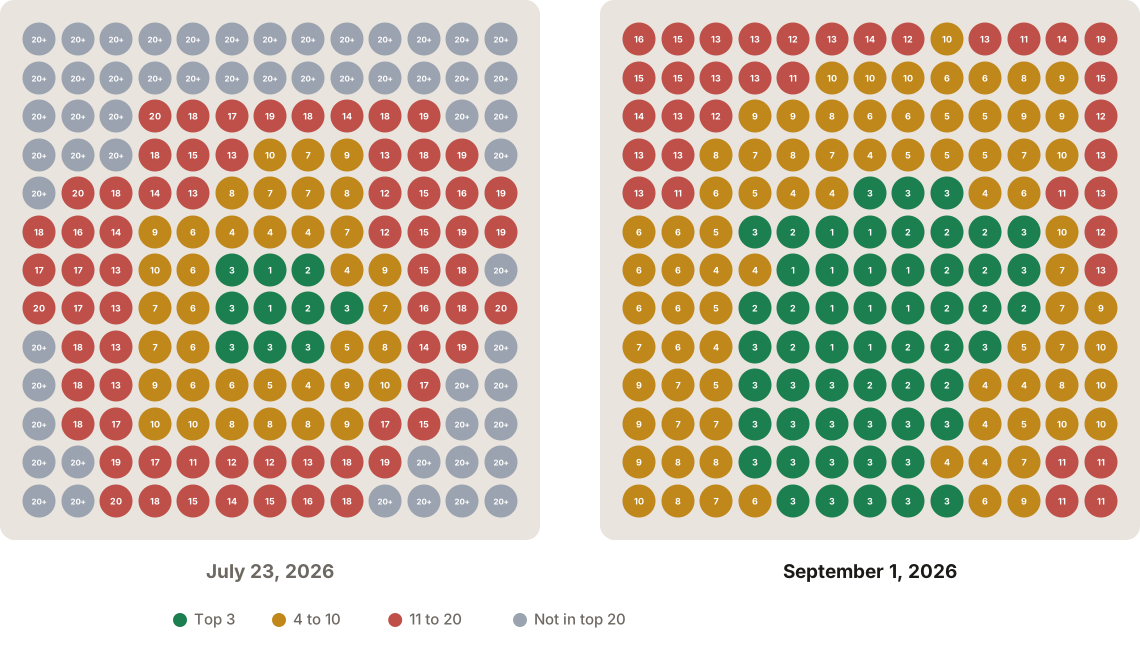
Seven searches were tracked on a 13-by-13 grid covering 6.5 by 6.5 miles, with 169 measurement points per keyword. The rank comparison uses the July 23 and September 1 scans.
Documented observations
The results, in context.
Source-site visualization for the selected search “painting contractor”: July 23 versus September 1, 2026. Its reported top-three coverage changes from 5.9% to 32.5%; this selected-keyword result differs from the seven-search average below.View full-size image ↗Source & context →
Historical result · July 23 → September 1, 2026
13.9% → 30.6%
Average top-three map coverage
An increase of 16.7 percentage points across the seven tracked searches; coverage describes measured grid points, not all local searches.
All seven tracked searches improved in average position and top-three coverage in the published comparison. The overall coverage increase is 16.7 percentage points (30.6 minus 13.9), or approximately 120% relative to the baseline. Those are two descriptions of the same change, not two additional outcomes.
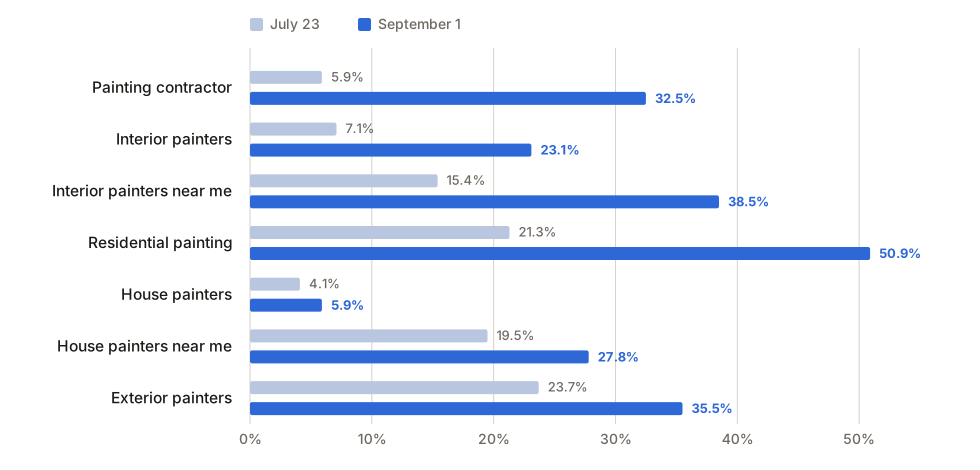
The variation between searches is useful. Residential painting reached 50.9% top-three coverage, while house painters reached 5.9%. The overall improvement did not mean every service term had become equally visible.
The August profile report also recorded 34 direction requests and 10 website clicks. These are activity totals, with no matching baseline supplied for those two measures; they do not establish completed jobs or revenue.
The source's keyword-by-keyword coverage chart preserves the July 23 and September 1, 2026 comparison. It shows why an improving average does not mean every search has the same coverage. This is a visualization supplied on the source site, not a raw account export.View full-size image ↗Source & context →
These observations apply to the periods shown. They are not a live account of this business’s performance or a guarantee of another business’s results.
Evidence & limitations
What the sources support.
This page documents work by Allen Quay, founder of Review Dingo, and adapts his published case study. The figures were checked against that source; the underlying account data was not independently audited for this page.
Content reviewed: . This is an editorial review date, not a new measurement date.
Published rank comparison
Owner-supplied Allen Quay case study: keyword table and evidence notes, July 23 and September 1, 2026. Headline coverage uses the more precise published endpoints of 13.9% and 30.6% rather than 14% and 31%.
Published profile activity summary
The same source reports 108 July impressions and 173 August impressions, with August direction-request and website-click totals. These belong to a separate calendar-month reporting window.
Limits of this evidence
The seven-week engagement extends to September 12, but the ranking endpoints are July 23 and September 1. Work completed after September 1 cannot explain the earlier comparison scan.
The public source describes the grid and search set. The underlying account exports and all scan settings were not independently audited for this adaptation.
The source's composite visibility-gain percentages are omitted because they are not the same measure as coverage, impressions, or customer growth.
This is an observed comparison without a control group. Competition, demand, Google changes, and other activity may contribute to the result.
Results vary by business, market, timing, and implementation. No review volume, rating, ranking, traffic, lead, or revenue outcome is guaranteed.
Your business, your starting point
See where your next opportunity could be.
Start with a free Reputation & Local Visibility Audit, then explore the managed support that fits your business.