A multi-location automotive engagement brought review requests, response expectations, and reporting into a shared operating process while retaining local accountability.
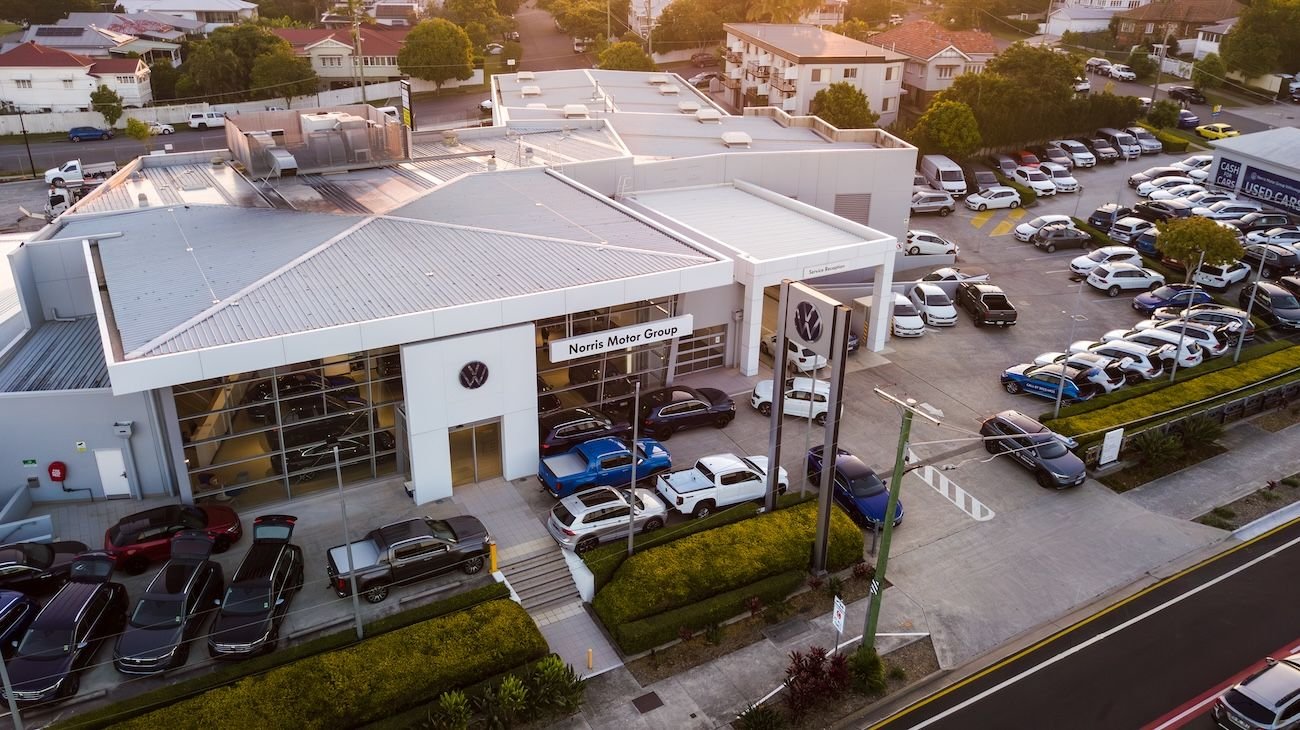
A Norris Motor Group Volkswagen location, shown for business context. Photo source ↗
Business
Norris Motor Group · 19 locations
Engagement period
Historical engagement; response chart extends to Q1 2023; launch year not shown
Contribution
Allen Quay served as a local SEO and reputation consultant on an agency engagement for an automotive group, designing the shared review operating model.
The starting point
The challenge.
Across 19 automotive locations, review requests and replies depended on individual store habits. The source describes inconsistent review volume, uneven ratings, infrequent responses, and limited group-level visibility.
A common operating process was needed so leadership could see what was happening without taking every customer interaction away from the local teams.
The work
What changed.
Allen Quay served as a local SEO and reputation consultant on an agency engagement for an automotive group, designing the shared review operating model.
Create a repeatable request flow
The engagement established consistent request triggers in the service journey, replacing separate store-by-store habits with a common process.
Set response and escalation expectations
Reply guidance, escalation rules, and response-time expectations gave teams a clearer way to handle feedback and identify cases requiring attention.
Preserve location-level accountability
Monitoring distinguished individual stores within the group so local exceptions remained visible.
Review the operation each month
Reporting brought review volume, rating movement, response coverage, and exceptions into a repeatable management view.
Documented observations
The results, in context.
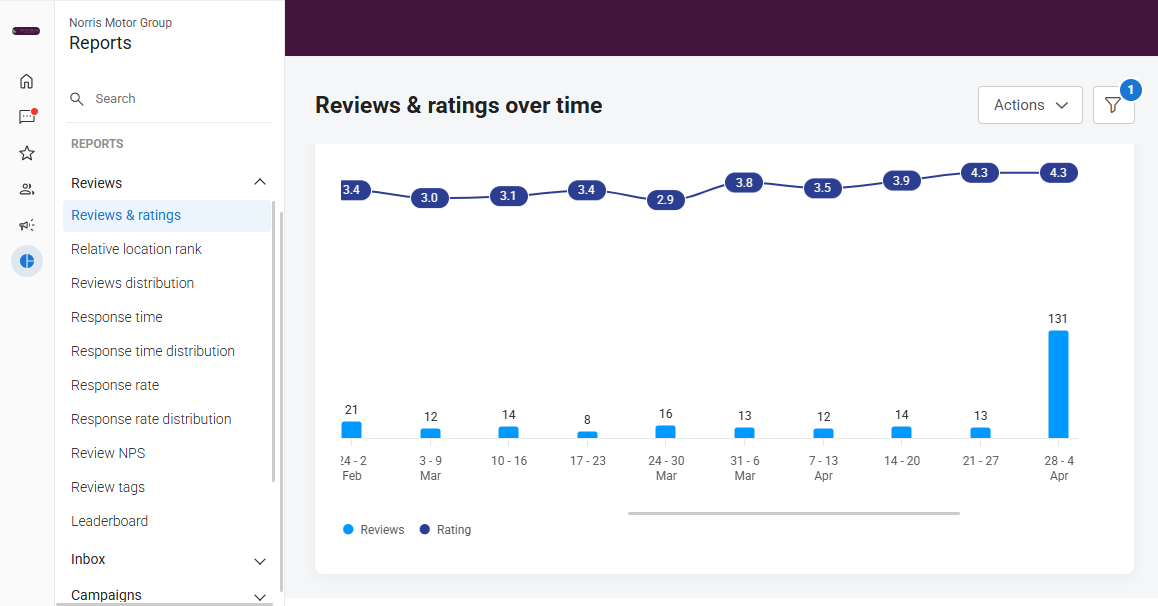
Original published weekly-review screenshot. The displayed comparison reaches 131 reviews; earlier visible weeks vary between 8 and 21. Month/day labels are visible but the year is not, so this is historical launch evidence rather than a dated current result.View full-size image ↗Source & context →
Historical result · Historical launch comparison; exact weeks not supplied
≈12 → 130+
Weekly reviews in the launch comparison
The published narrative gives an approximate baseline and an endpoint above 130. The illustrated comparison week is reported as 131; this is not a sustained weekly forecast.
Historical result · Selected quarters in the historical chart ending Q1 2023
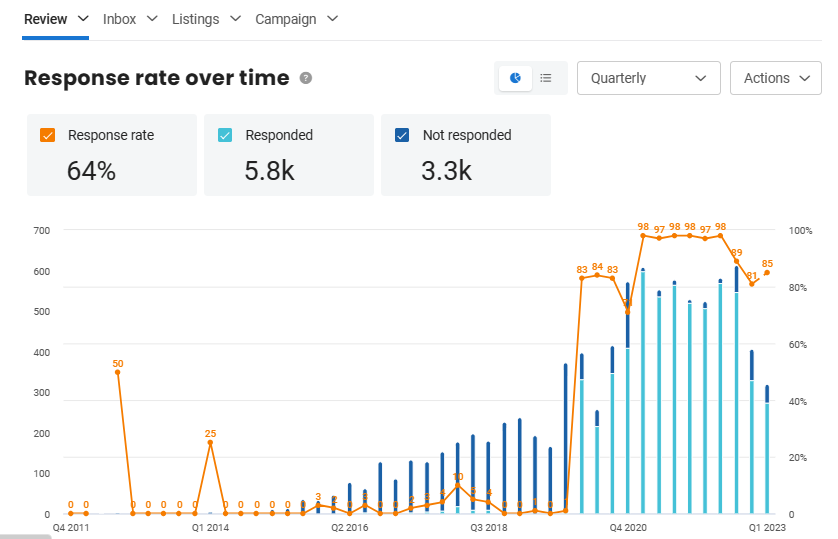
97–98%
Response coverage in several historical quarters
These are selected high-coverage quarters, not a sustained rate across the whole period. Later displayed quarters include 89%, 81%, and 85%; the full-history summary is 64%.
The published launch comparison records a substantial increase in weekly review volume. The historical response chart also shows improvement from a long period of very low coverage to several quarters at 97–98%, followed by lower quarters. These measures describe two different parts of the workflow: customers leaving reviews and the business responding to them.
The operating lesson is the connection between requests, local ownership, escalation, and reporting. A higher review count alone would not show whether teams were responding consistently or whether customer concerns were reaching the right person.
Later lifetime review totals and a group-average rating appear in the original story. They are excluded from this page's results because the supplied public narrative does not identify their snapshot date.
Original published response chart, with an axis extending through Q1 2023. Several quarters show 97–98% coverage; later displayed quarters include 89%, 81%, and 85%. The 64% summary is the full-history average, not the rate in those selected quarters.View full-size image ↗Source & context →
These observations apply to the periods shown. They are not a live account of this business’s performance or a guarantee of another business’s results.
Evidence & limitations
What the sources support.
This page documents work by Allen Quay, founder of Review Dingo, and adapts his published case study. The figures were checked against that source; the underlying account data was not independently audited for this page.
Content reviewed: . This is an editorial review date, not a new measurement date.
Published launch-period comparison
Owner-supplied Allen Quay case study: results narrative and weekly-review screenshot. The image shows month/day labels but no year. Norris Motor Group is named with the owner's confirmed client permission; only the already-public reporting image is reproduced.
Published historical response chart
The response screenshot has quarterly labels through Q1 2023, a 64% full-history summary, selected quarterly rates of 97–98%, and later rates below 90%. The image qualifies the narrative's broader 90%+ wording; it is not evidence of present-day coverage.
Limits of this evidence
The weekly launch screenshot does not show a year. The separate response chart has a historical axis extending from Q4 2011 to Q1 2023; it does not identify the launch date or establish that Allen managed the whole displayed history.
The baseline review volume is approximate. No precise percentage-growth or annualized projection is calculated from it.
The source narrative describes 90%+ post-deployment coverage, but its chart also shows later quarters below 90%. This adaptation uses the visible 97–98% selected-quarter figures and discloses the lower quarters. The 64% summary has a different, full-history denominator.
This was Allen's contribution within an agency engagement. It is not presented as proof that a current Review Dingo package alone caused the change, or that the same figures apply to every location.
No revenue, lead, ranking, or customer-retention effect is established by these review and response measures.
Results vary by business, market, timing, and implementation. No review volume, rating, ranking, traffic, lead, or revenue outcome is guaranteed.
Your business, your starting point
See where your next opportunity could be.
Start with a free Reputation & Local Visibility Audit, then explore the managed support that fits your business.